Improve ability to visualize large and complex data sets, ranging from simple graphs, to maps generated using public GIS data, to videos illustrating the orbital paths of exoplanets.
Tools: Python, MatPlotLib, Pandas
Gallery
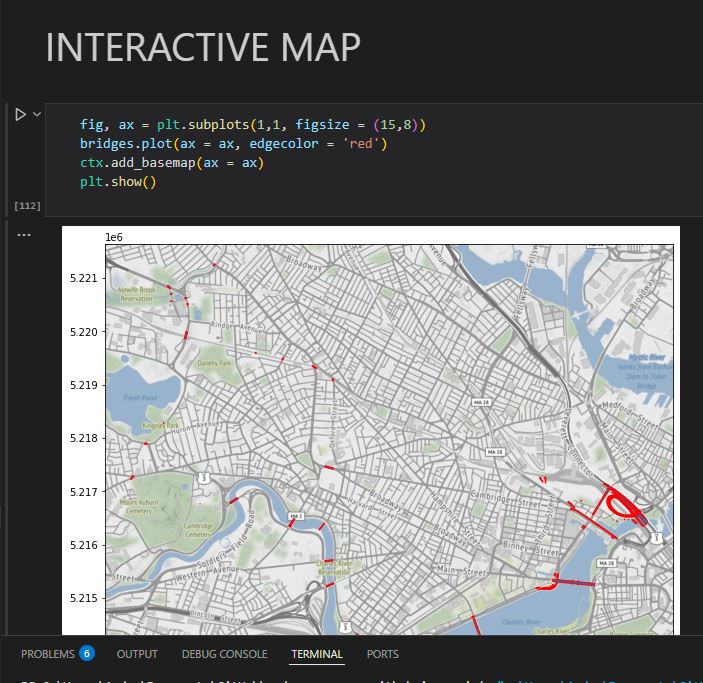
Bridge network visualization using public GIS data.Orbital path animations of discovered exoplanets.Simple graph created in MatPlotLib and Pandas.