Materials Lab · Team Project
This lab measured the linear thermal expansion of 6061-T6 aluminum by cycling four samples between dry-ice cooling and boiling-water heating, tracking length change against temperature to compare against the textbook expansion coefficient.
The goal was to quantify how temperature affects the length of aluminum under controlled conditions, following the standard thermal expansion relationship ΔL = L₀αΔT. Four 6061-T6 aluminum samples, each cut to six inches, were used so results could be compared across specimens. An initial plan to use a 3D printer warming plate was scrapped in favor of dry ice for cooling and a hot plate with boiling water for heating — the printer plate couldn't heat evenly, reach a wide enough temperature range, or heat quickly enough.
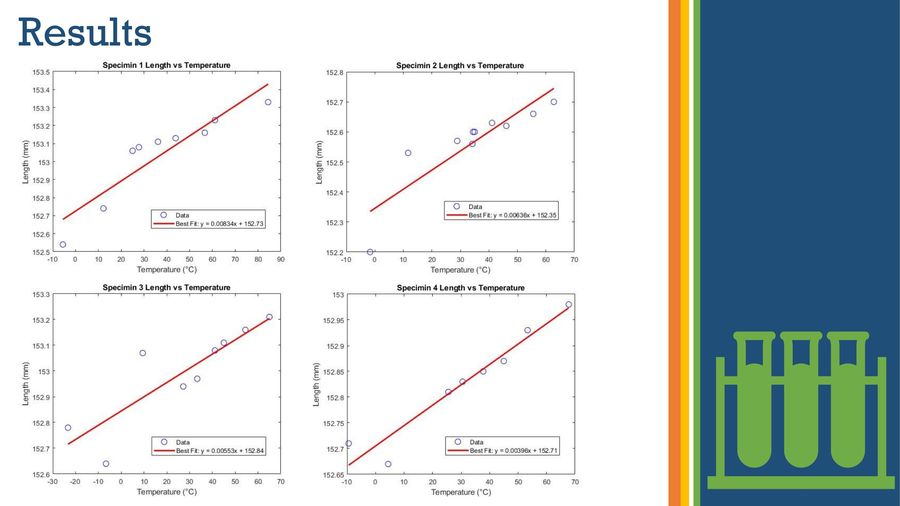
Samples were placed in a dry-ice-filled cooler and, after roughly ten minutes to equilibrate, measured for length and temperature every 30 seconds as they warmed back to room temperature. The same samples were then heated in a pot of boiling water on a hot plate for about five minutes and measured again every 30 seconds as they cooled back down, building a full length-versus-temperature dataset for each specimen.
Linear best-fit lines through each specimen's data produced measured expansion coefficients well above the textbook range of 21–24 microstrain per °C for aluminum — errors ranged from 65% to 260% across the four samples. Restricting the analysis to only the heated-side data (excluding the cooled specimen readings) improved results for most specimens, bringing errors down to roughly 55–83%, though one specimen actually got worse under this restriction.
The IR thermometer was likely the largest source of error: rated only down to -4°F, it couldn't register accurate readings while the dry-ice-cooled samples were still well below its range, which cut short the usable cold-side dataset. Caliper positioning was a secondary factor — keeping consistent pressure and placement on the sample between the cooled and heated measurement phases proved difficult, and small positioning shifts measurably affected the readings.